Purpose
The Dashboard is the first landing page that a user sees when logging in to Drive Practice.
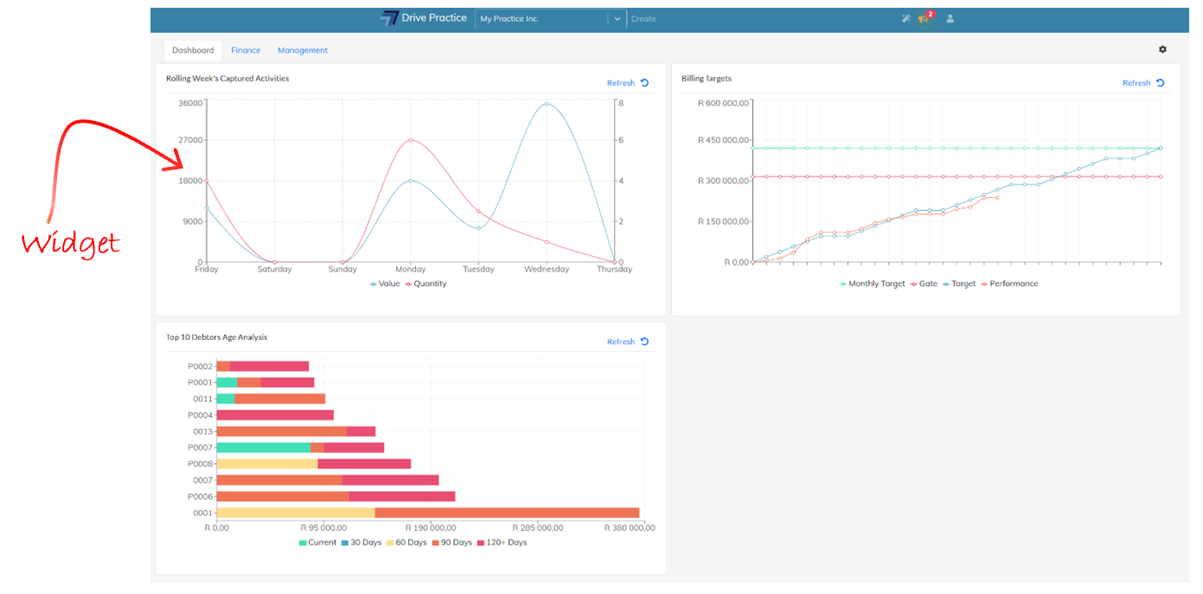
Dashboards comprise of widgets which have been assigned to users either through a user profile or directly to the user.
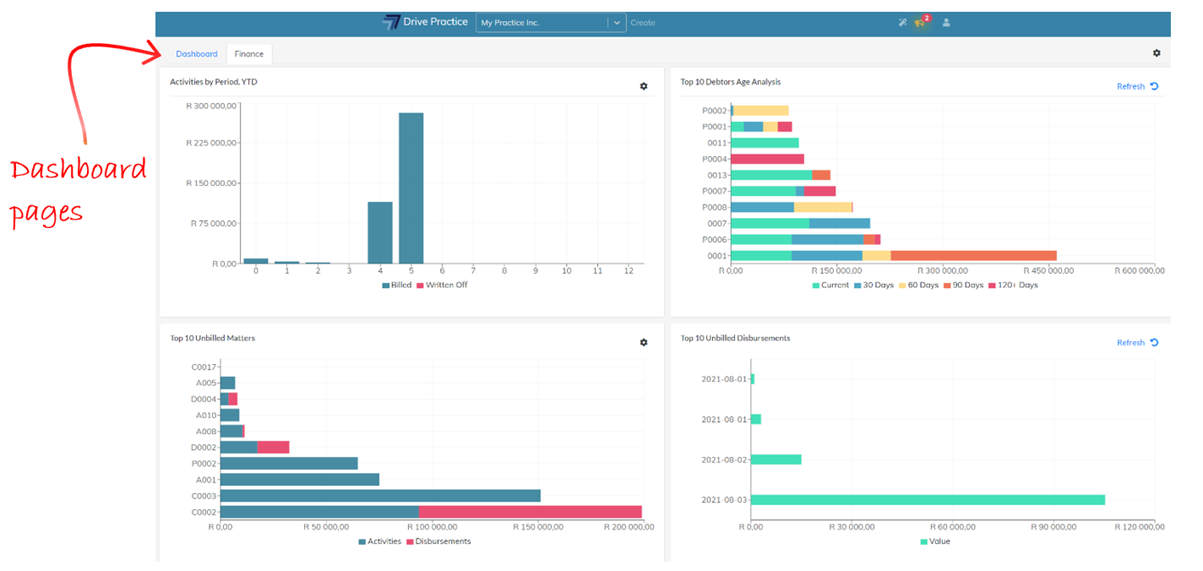
Dashboard widgets can be arranged over multiple pages and are used to provide relevant information and insight to the user who has logged in. Users can move, remove, re-size and add widgets on dashboard pages according to their preference.
The Dashboard is designed to visually present various aspects of the business and logged in users performance, depending on the role of the logged in user in the practice, in order to make informed decisions quickly should action need to be taken to improve their own or the practice performance.
Very often legal professionals do not have a lot of knowledge of accounting, and even if they do, they don’t necessarily have the time to wade through detailed reports to understand how their practice is faring, especially as these reports are typically “after the fact”, presenting what has happened in the practice with no insight into what the future holds for the practice.
The latter half of the 20th Century was the “rebirth of data visualization” due to the fact that computerization meant that large volumes of data could be relatively easily crunched to depict business performance visually, reducing decision making time thereby improving outcomes for businesses where action was taken quickly to avoid problems that were highlighted, or investment was made to grow the business where indicated.
In the last decade of the 20th Century the concept of the Balanced Scorecard was introduced by Professors Kaplan and Norton through a year long study in 1991. Their scorecard identified that there are lagging and leading indicators of business performance, with financial data being a lagging indicator since it is after the fact and that various other indicators of future performance such as customer satisfaction, customer acquisition, retention and growth, streamlining business processes and learning and innovation in a business may be of equal if not greater indicators of future success.
Most practitioners have or should have, a sense of what their overheads for the practice are and a review of the expense section of the income statement for a couple of previous months can deliver this insight.
With this knowledge in mind, collectively managing collections from clients and payments to suppliers and SARS for VAT, together with watching that the cumulative WIP each month tracks to a fee level to support such overheads, and ensuring that the number of new instructions are steadily coming in, is more telling for a practitioner on the health of the practice than endlessly studying complex management accounts.
Using the Dashboard Function
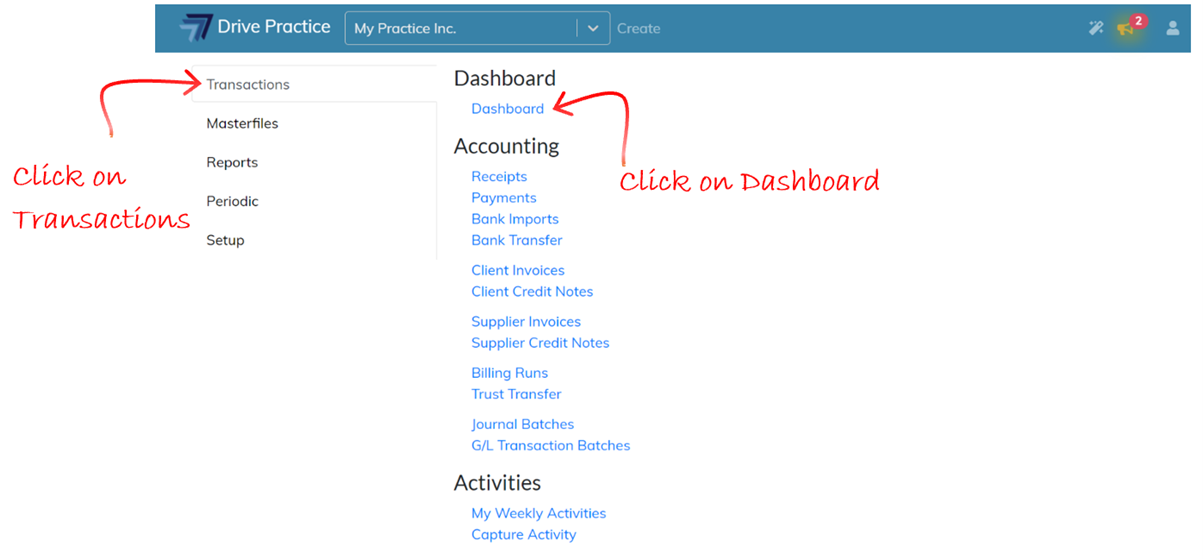
To view the dashboard once the user has navigated away from the dashboard screen after logging in, click on the Drive Practice logo and click on the Transactions menu on the left and select the Dashboard option on the right.
Dashboards are comprised of widgets, one or more of which could be assigned to the default dashboard assigned to the logged in user.
Dashboard widgets can be arranged over multiple pages, grouping widgets together to provide a comprehensive visual across topics such as work in progress (WIP), finance, and management information for example. Moving between dashboard pages causes the widgets on the page that loads to refresh so that the widget visuals are up to date on the page displayed.